2 getting started
We begin with a brief self-assessment, asking you to reflect on your own knowledge of data science, including the necessary-but-not-sufficient areas of computer programming and statistics. We then move to a description of some rudimentary tools that we will be using, then install the R programming environment on our laptops.
2.1 are you already a programmer and statistician?
Regarding programming, you may know more than you think you do. Here’s a simple program - a set of instructions - for producing a cup of coffee:
add water to the kettle and turn it on
if it’s morning, put regular coffee in the French press, otherwise use decaf
if the water has boiled, add it to the French press, else keep waiting
if the coffee has steeped for four minutes, depress (smash) piston/plunger, else keep waiting
pour coffee into cup
enjoy
As a post-millennial student from a WEIRD culture, or Western, Educated, Industrialized, Rich Democracy [@henrich2010], you’ve ‘programmed’ computers, too, if only to enter a password, open an app, and upload a photo on your cell phone.
Statistics is of fundamental importance, not just for understanding abstract trends, but for making decisions about everyday life. Consider the case of a senior undergraduate who wants to go to med school. How many schools should she apply to?
Exercise 2_1 Susie is applying to two med schools. At School A, 25% of students are accepted, and at School B, 25% are accepted as well. You are Susie. Are you going to get in to at least one of these programs? What is the probability? Does your estimate depend upon any assumptions?
Questions such as these are important for us. If the combined probability is low, it will likely (another probability concept) make sense for Susie to spend the time, money, energy, and ego-involvement to apply to additional programs. If the probability is higher, it may not. But problems like this are hard - our estimates of probability are frequently poorly calibrated, and combining probability estimates is challenging (see, e.g., [@tversky1974], and consider taking a course in Behavioral Economics or Thinking and Decision Making to learn more).
2.2 spreadsheets - some best practices
Spreadsheets are handy tools, particularly for smaller datasets. You may have worked with data in spreadsheets such as Microsoft Excel or Google Sheets. If you haven’t here’s a start:
Exercise 2_2 Open the Google Sheet at http://bit.ly/dslaX2_1. Save a copy and edit it, entering the following in cell B7:
=SUM (B2:B6)
What is the result?
Now copy cell B7 to C7
What happens? Is this the result you expected?
Spreadsheets are great tools - the first one, VisiCalc, was the first “killer app” to usher in the personal computer revolution. But spreadsheets have limitations as well. Best practices have been proposed for using spreadsheets in data science such as, for example, including only data (and not calculations) in spreadsheets, using what we will recognize as a ‘tidy’ format in which data are in a simple rectangle (that is, avoid combining cells and using multi-line headers), and saving spreadsheets as simple text files, typically in comma-delimited or CSV format [@broman2018]. Typically, this means that each worksheet will be in a separate file, rather than in workbooks with multiple tabs.
There are good reasons for these recommendations: When we manipulate data in spreadsheets, we typically will not have a record of what was (and wasn’t) changed, and this compromises the reproducibility of our work. Similarly, when we sort data in spreadsheets, we risk chaos, for example, if we sort only certain columns, the integrity of spreadsheet-rows will be lost.
In general, spreadsheets should generally be used to store data rather than to analyze it. But don’t be a slave to this - if you are making some quick calculations that are inconsequential and/or to be used on just one occasion, working in Excel or Google Sheets is often the way to go.
2.3 setting up your machine: some basic tools
Documents produced in word processors typically include invisible characters used for formatting, security, etc. These characters, when fed into a computer program, lead to unpredictable results. Markdown (MD) is a simple syntax for producing documents that are easily read by both humans and machines. Most of the documents you will produce and work with this term, including the present chapter, are and will be written in some version of Markdown. Three markdown editors are worth considering. The newest is Obsidian, which is free and includes an extended version of Markdown that allows the drawing of simple network graphs. Typora has an attractive minimalist interface, but is no longer free ($15). Finally, RStudio - the environment within which we will be using R - has a built in visual markdown editor as well.
Collaboration and communication are integral to data science. In the world beyond universities, the most important messaging and collaboration platform is Slack. Slack is a commercial app, but it has a free tier. Slack is handy for group work of all forms, but most universities use collaborative tools embedded in Learning Management Systems such as Canvas instead.
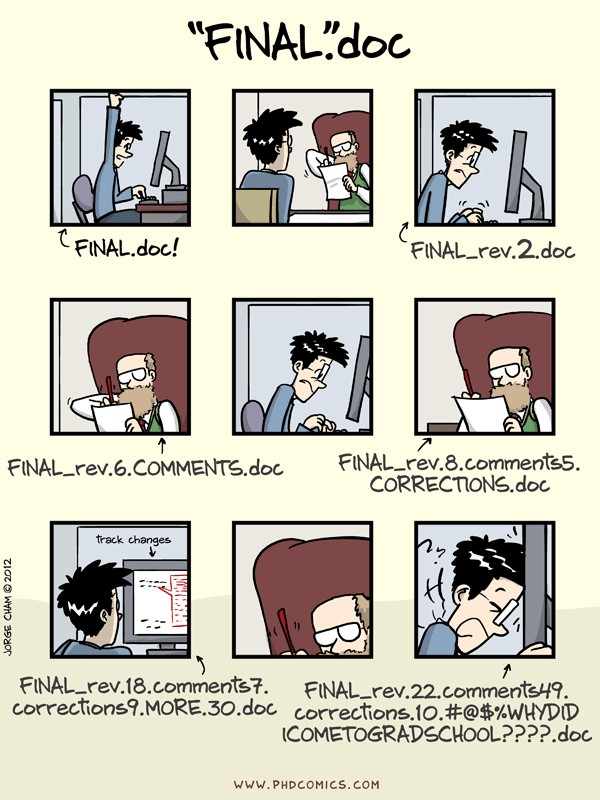
While Microsoft Word has the advantages of familiarity, ease-of-use offline, and extensive formatting capabilities, Google Docs has several advantages over Word. Google Docs is free, it is convenient for collaborative work (as it allows simultaneous editing), and it provides a solid framework for version control, a critical skill in information management. Version control can help you avoid the chaos and confusion of having a computer (or several computers) full of files that look like Cham’s (2012) comic:
Version control is an important concept in data science. Collaboratively built programs and platforms, including most of the add-ons (libraries, packages) which make R so powerful, are open-source projects built by many individuals over time. For projects such as these, both the current build and its associated history are typically maintained on GitHub, a website for hosting code. When we contribute to these projects, we will first mirror the web-based GitHub site using a program on our own Macs or Windows PCs called Git, then upload our proposed changes. Keeping remote and local branches of files in sync can be challenging, however, and you will not be expected to use this technology in this class. But if you are curious, or want to learn more, an introduction to using Git and R together may be found here.
2.4 a (modified) 15-minute rule
While AI tools for coding, including Microsoft Copilot, are helpful for addressing the idiosyncacies of coding syntax, at some point, you will run into problems - if you don’t you aren’t learning enough. An important determinant of your success will be the balance you maintain between persistence and help-seeking.
The 15-minute rule is one guideline for this balance: It has been cleverly summarized as “You must try, and then you must ask.” That is, if you get stuck, keep trying for 15 minutes, then reach out to others. I think that this rule is basically sound, particularly if it is applied with cognitive flexibility, social sensitivity, and reciprocity. So when you get stuck, make a note of the problem, then move to another part of your project (that’s the cognitive flexibility part): This allows your problem to percolate and still make progress. When you ask others for help, ask in a way that shows an awareness of the demands on their time (social sensitivity): Part of this means that you should explain your problem in as detailed a fashion as possible - in technical terms, a “reprex” or reproducible example. Finally, you should be willing to provide as well as give help (reciprocity).