5 now draw the rest of the owl
 In the process of learning R, you’ll reach
# exploring R world
DataCamp:
Swirl (Swirlstats): Install: https://swirlstats.com/students.html then see https://swirlstats.com/scn/rprog.html
Posit recipes: download a csv file from canvas
https://posit.cloud/learn/recipes then
Hints: biggest obstacle for noobs is finding where you are on your disk. - set up a directory for this class, then a subdirectory you can call Assignment01.
working with rprojects
In this chapter, we’ll learn how to install and use R in two ways - in the cloud and on your own laptop. For each of these, we’ll use RStudio
5.1 Using RStudio cloud
Using the link provided to you by your instructor, set up a new account in RStudio (it is free for you). Then click on the Join Space button. It will bring you to the Welcome page. (Not much to see here as yet). Click on the hamburger menu. You should see, on the left side of the screen, a menu with three sections: Spaces, Learn, and Help.
The Spaces menu will likely include three options. The first will be “Your Workspace,” the second will be the workspace for this class (e.g., IntroDataSciSpring21), and the third will allow you to create a “New Space.”
Click on the class workspace, then on the first assignment. After a few seconds, you’ll see a screen that looks something like the following:
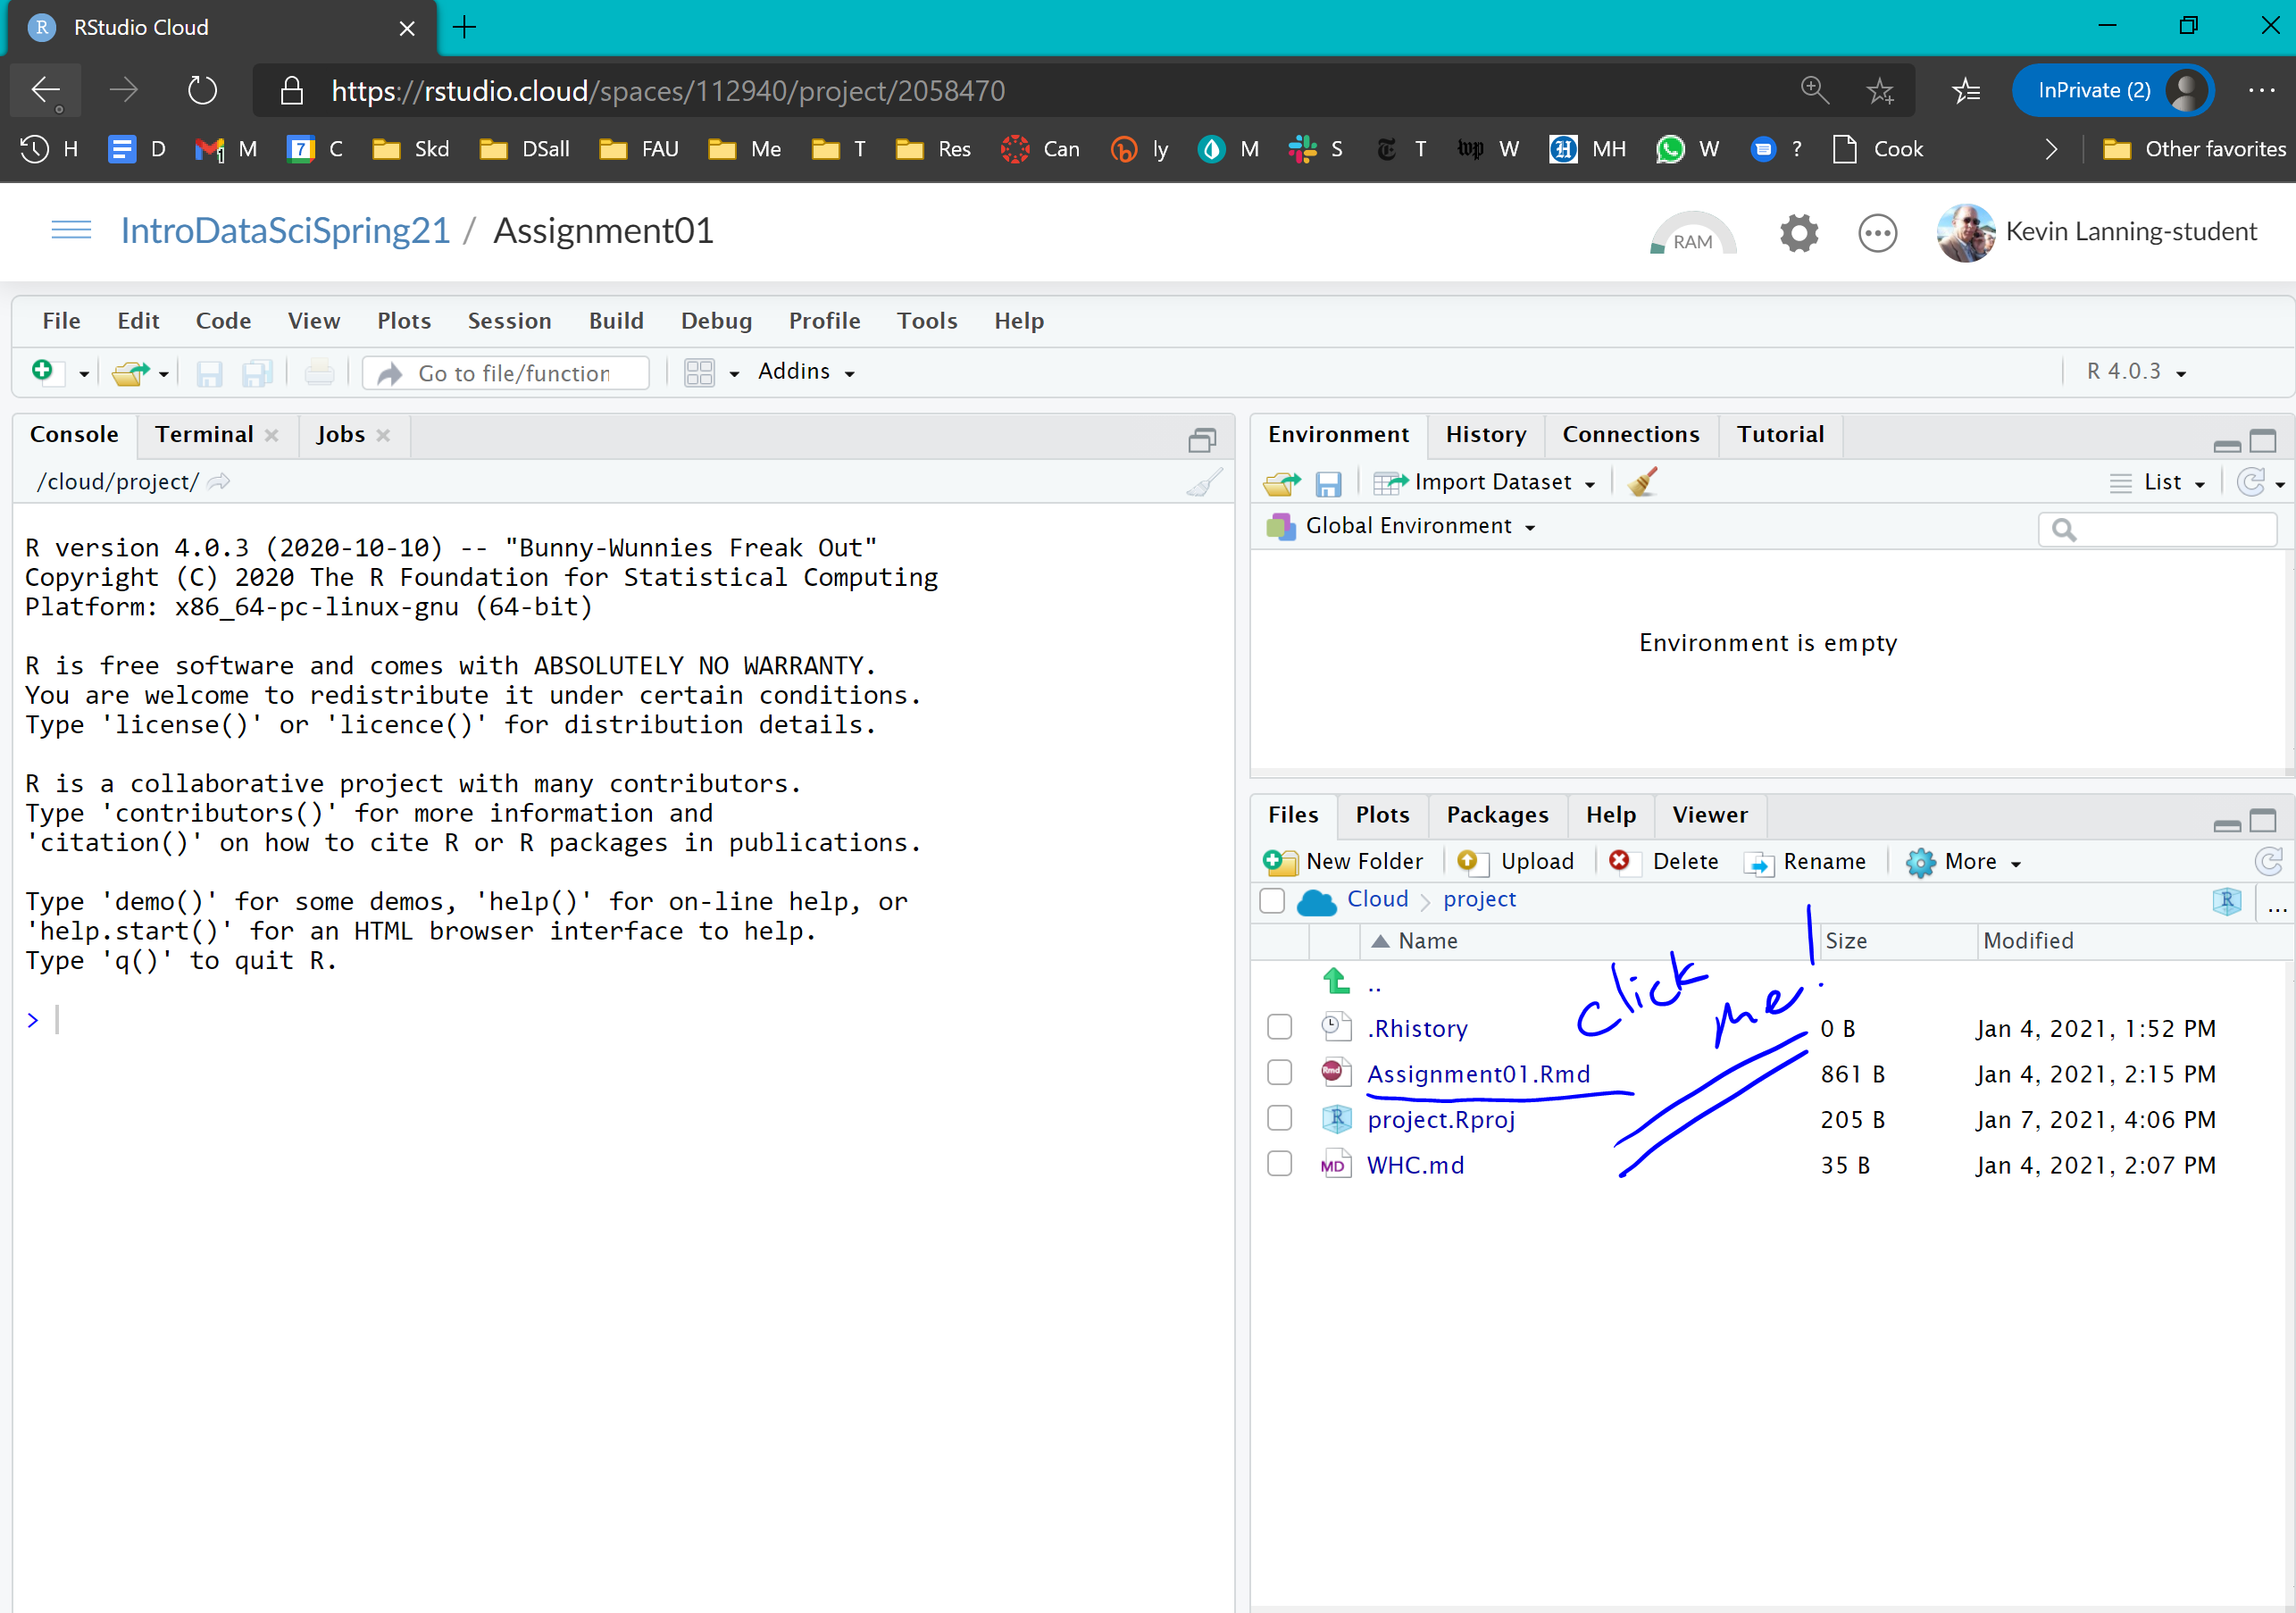
Click on the assignment, and you’ll see that there are now four windows on the screen (note that these windows are fully customizable, so that the locations and characterizations I am giving here are just a starting point):
In the upper left is the source window - the code you are working on.. This is where we will be doing much of our work, typically in R markdown documents like this one. R markdown is, not surprisingly, a ‘flavor’ of markdown. Other tabs in this quadrant may include displays of your data and other scripts that you may be working on.
The console, by default in the lower left quadrant, can be used to execute single lines of code. You may occasionally use the terminal tab here as well.
The environment, in the upper right, includes datasets, variables, and functions that are available to us. The Build and Git tabs are useful for producing documents and version control/collaboration, respectively. The history tab is useful to go back and look at the syntax you used in a prior chunk of code.
The files in our directory are listed in the lower right; additional tabs include a list of available packages (libraries) and some resources for help.
Now read the code in the console, and follow the instructions to complete your first homework assignment. Congratulations, you’ve just run your first code in R.
5.2 Using R Studio on your laptop
Install the latest version of R on your own Windows or Mac laptop. Then install RStudio Desktop.
Feeling ambitious? Once this is loaded, (a) set up a directory for this class, then (b) a subdirectory you can call Assignment01.
Go back to your Rstudio.cloud / Assignment01, and check the boxes next to Assiignment01.Rmd, movies.Rdata, and project.rproj. Then click on ‘More’, then ‘Export…’ and put these in your new subdirectory.
Now go back to your desktop environment, and try to run the same code on your home machine. (Note that to be successful, you will need to first execute the command on your laptop).
install.packages(“tidyverse”)
In this chapter, we’ll learn how to install and use R in two ways - in the cloud and on your own laptop. For each of these, we’ll use RStudio as a front end (an ‘integrated development environment’, or IDE).
Click on the assignment, and you’ll see that there are now four windows on the screen (note that these windows are fully customizable, so that the locations and characterizations I am giving here are just a starting point):
In the upper left is the source window - the code you are working on.. This is where we will be doing much of our work, typically in R markdown documents like this one. R markdown is, not surprisingly, a ‘flavor’ of markdown. Other tabs in this quadrant may include displays of your data and other scripts that you may be working on.
The console, by default in the lower left quadrant, can be used to execute single lines of code. You may occasionally use the terminal tab here as well.
The environment, in the upper right, includes datasets, variables, and functions that are available to us. The Build and Git tabs are useful for producing documents and version control/collaboration, respectively. The history tab is useful to go back and look at the syntax you used in a prior chunk of code.
The files in our directory are listed in the lower right; additional tabs include a list of available packages (libraries) and some resources for help.
Get as far as you can, but remember the 15 minute rule. How far did you get? Be prepared to share your frustrations, discoveries, and accomplishments with your classmates.R stands for …
Historically, R grew out of S which could stand for Statistics. But what does R stand for?
R is a system for Reproducible analysis, and reproducibility is essential. R markdown documents, like Jupyter notebooks in the Python world, facilitate reproducible work, as they include comments or explanations, code, links to data, and results.
R is for Research. Research is not just an end-product, not just a published paper or book:
… these documents are not the research [rather] these documents are the “advertising”. The research is the “full software environment, code, and data that produced the results”
(buckheit1995?; donoho2010?). When we separate the research from its advertisement we are making it difficult for others to verify the findings by reproducing them (gandrud2013?).
R is a system for Representing data in cool, insight-facilitating ways, a tool for creating (reproducible) data visualizations which can provide insights and communicate results.
R is Really popular, and this matters, because learning R will make you a more attractive candidate for many graduate programs as well as jobs in the private sector.
Because R is popular, there are many Resources, including, for example -
- Online resources include the simple (and less simple) lessons of SwirlR, which offers the possibility of “learning R in R,” as well as DataCamp, the Data Science Certificate Program at Johns Hopkins, and other MOOCs.
- Books include (peng2014?) - which includes not only videos of his lectures in the program at Hopkins, but also a brief list of still more resources - and (wickham2016?).
- You’ll also learn (more directly) from people, including your classmates, as well as the broader community of people around the world. There are hundreds if not thousands of people, young and old, who are on the road with you. I am as well, just a step or two (hopefully) ahead.
R might stand for Relatively high level. Programming languages can be described along a continuum from high to low level, the former (like R) are more accessible to humans, the latter (like assembly language) more accessible to machines. Python, Java, and C++ are all more towards the middle of this continuum.
R does not stand for ‘[arggh](https://www.urbandictionary.com/define.php?term=ARGH),’ although you may proclaim this in frustration (‘arggh, why can’t I get this to work?) or, perhaps, in satisfaction (’arggh, matey, that be a clever way of doing this’).
But R does stand for Rewarding. A language is a way of thinking about the world, and this is true for computer languages as well. You’ll be challenged by its complexity, its idiosyncracy, its alien logic. But you will succeed, and you will find that you can do things that you did not believe possible.
5.3 a few characteristics of R
R includes the base together with packages. These packages (libraries) are customized add-ons which simplify certain tasks, such as text analysis. There are, at this writing, 15,373 available packages on the CRAN package repository - and though there is not yet an R package for ordering pizza (peng2014?), there are many for most data tasks, including, for example, over 50 different packages for text analysis. So how do you choose, and where do you begin? We will start with the curated list of packages which jointly comprise the tidyverse (wickham2016?), which is effectively a dialect of R.
R is an object-oriented language - one conceptually organized around objects and data rather than actions and logic. In R, at the atomic level, objects include characters, real numbers, integers, complex numbers, and logical. These atoms are combined into vectors, which generally include objects of the same type [one kind of object, ‘lists,’ is an exception to this; (peng2014?)]. Vectors can be further combined into data frames, which are two-dimensional tables or arrays. A tibble is a particular type of data frame which is used in the tidyverse. It is, in some ways, handier to work with than other data frames. We’ll be working extensively with data frames in general, and tibbles in particular, as we move forward.
Objects have attributes. Attributes of R include such things as name, dimensions (for vectors and arrays), class (that’s the type of object described in the previous paragraph), length, etc.
Real world data sets are messy, and frequently have missing values. In R, missing values may be characterized by NA (not available) or NaN (not a number, implying an undefined or impossible value).
RStudio, the environment we will use to write, test, and run R code, is a commercial enterprise whose business model, judged from afar, is an important one in the world of technology. Most of what RStudio offers is free (97% according to Garrett Grolemund in the video below). The commercial product they offer makes sense for a relative few, but it is sufficiently lucrative to fund the enterprise. The free product helps to drive the popularity of Rstudio; this widespread use, in turn, makes it increasingly essential for businesses to use. This mixed free/premium, or ‘freemium,’ model characterizes Slack as well, but while the ratio of free to paid users of Slack is on the order of 3:1, for R it is, I am guessing, an order of magnitude higher than this.
5.4 finding help
One does not simply ‘learn R.’ Unlike, say, learning to ride a bicycle, fry an egg, or drive a car with a manual transmission, learning R is not a discrete accomplishment that one can be said to have mastered and from which one then moves on. Rather, R is an evolving, open system of applications and tools which is so vast that there is always more that one can achieve, new lessons that one can learn. And, the complexity of R syntax is such that, for almost all of us, we will need help for coding on any non-trivial task.
For us, the key ideas in “looking for help” will include not just the tools on the RStudio IDE, but also (a) using Google searches wisely, and (b) reaching out to your classmates on Slack.
Here, as in the real world, there is an etiquette for help-seeking which is based on consideration. Your search for help should begin by making sure that others will encounter the same result, then by stripping the problem down to its essence. Once you have reduced the problem to this minimal, reproducible essence, you will often be able to spot the problem yourself - and, if not, you will make it easier for others to help you. There is an R package (reprex) which will likely facilitate this, but I haven’t tried it yet. Here is a good introduction.
Again, remember the 15 minute rule - we all need somebody to lean on.
Finally, to get a sense of some of the ways you can get help in RStudio (and to see how a master uses the R Studio interface), consider this video:
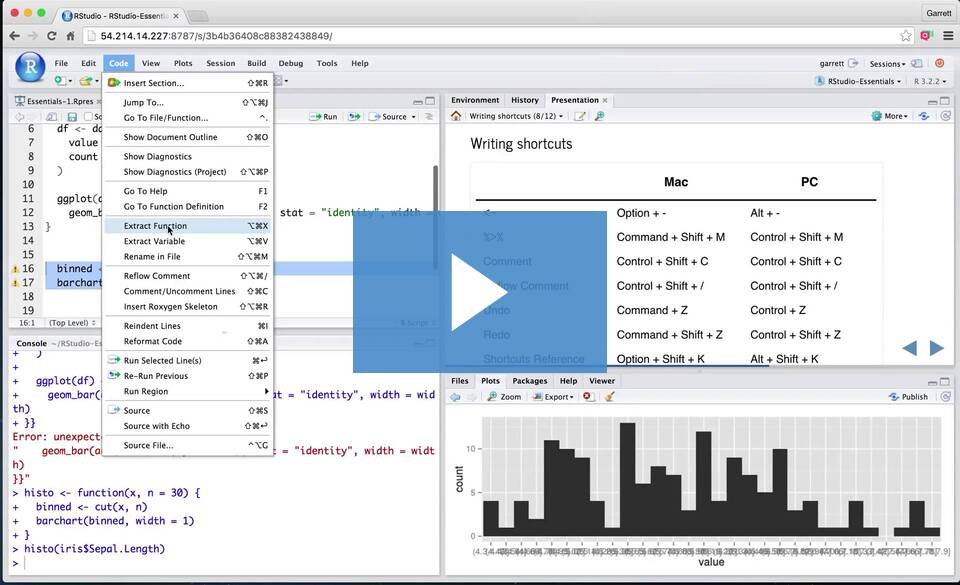
video 4.1: Garrett Grolemund of RStudio
5.5 Wickham and R for Data Science
The first chapter of the Wickham text (wickham2016?) provides both a framework for his approach and a brief introduction to the tidyverse which will be the dialect of R we will study in the weeks ahead.
Please read it now.