1 data science for the liberal arts
Hochster, in (hicks2018?), describes two broad types of data scientists: Type A (Analysis) data scientists, whose skills are like those of an applied statistician, and Type B (Building) data scientists, whose skills lie in problem solving or coding, using the skills of the computer scientist. This view arguably omits a critical component of the field, as data science is driven not just by statistics and computer science, but also by “domain expertise:”
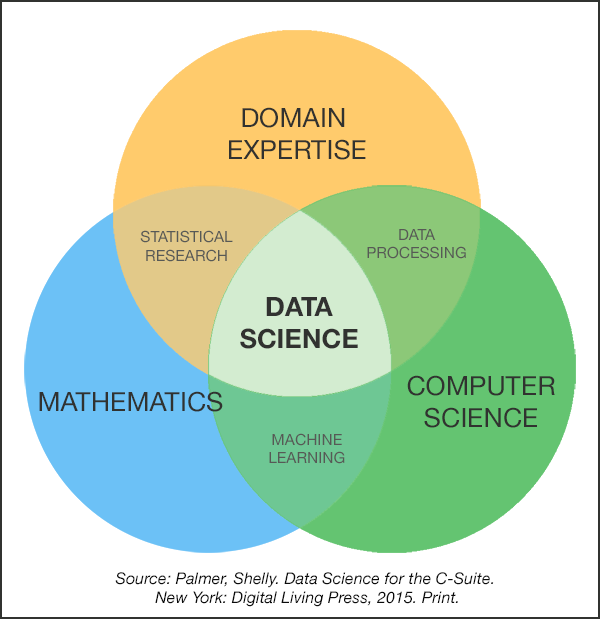
The iconic Venn diagram model of data science, as shown above, suggests that there are not two but three focal areas in the field, one of which begins not with math or computer science, but with “domain expertise.” Data science for the liberal arts is a ‘Type C’ approach, where ‘C’ refers to a concentration of concern in the arts, humanities, social and/or natural sciences. For the Type C data scientist, coding is in the service of applied problems and concerns.
Type C data science does not merely integrate ‘domain expertise’ with statistics and computing, it places content squarely at the center. We can appreciate the compelling logic and power of statistics as well as the elegance of well-written code, but for our purposes these are means to an end. Programming and statistics are tools in the service of social and scientific problems and cultural concerns. Type C data science aims for work which is not merely cool, efficient, or elegant but responsible and meaningful.
At the risk of oversimplifying:
Type A data scientists focus on Analysis and questions about ‘how?’
Type B data scientists focus on Building and questions of ‘what?’
Type C data scientists focus on Consideration and questions of ‘why?’, ‘who?’, ‘what for?’, and ‘at what (social) cost?’
1.1 the incompleteness of the data science Venn diagram
Data visualizations are starting points which can provide insights, typically highlighting big truths or effects by obscuring other, presumably smaller ones. The Venn diagram model of data science is no exception: As with other graphs, figures, and maps, it allows us to see by showing only part of the picture. What does it omit? That is, beyond mathematics, computing, and domain expertise, what other skills contribute to the success of the data scientist?
1.1.1 additional domains
For the liberal arts data scientist, we can note at least three additional important domains, that is, communication, collaboration, and citizenship.
Communication, including writing and the design and display of quantitative data, is central to data science because results are inconsequential unless they are recognized, understood, and built upon. Facets of communication include oral presentations, written texts and good data visualizations.
Collaboration is important because problems in data science are sufficiently complex so that any single individual will typically have expertise in some, but not all, facets of the area. Collaboration, even more than statistical and technical sophistication, is arguably the most distinctive feature of contemporary scholarship in the natural and social sciences as well as in the private sector (isaacson2014?).
Citizenship is important because we are humans living in a social world; it includes serving the public good, overcoming the digital divide, furthering social justice, increasing public health, diminishing human suffering, and making the world a more beautiful place. The Type C data scientist is aware of the fact that the world and workforce are undergoing massive change: This puts the classic liberal arts focus of “learning how to learn” (as opposed to memorization) at center stage. Finally, the Type C data scientist is sensitive to the creepiness of living increasingly in a measured, observed world. These real-world goals should be informed by ethical concerns including a respect for the privacy and autonomy of our fellow humans.
Reproducibility is related to communication, collaboration, and citizenship. There has been something of a crisis in recent years in the social and natural sciences as many results initially characterized as “statistically significant” have been found not to replicate. The reasons for this are multiple and presently contentious, but one path towards better science includes the public sharing of methods and data, ideally before experiments are undertaken. With the large datasets that are often available in contemporary data science, statistical significance is rarely a concern and other indices, including measures of effect size, are typically of primary interest.
1.1.2 an additional dimension
Cutting across these various facets (statistics, computing, domain expertise, collaboration, communication, and citizenship), a second dimension can be articulated. No one of us can excel in all of these domains, rather, we might aim towards a hierarchy of goals ranging from literacy (can understand) through proficiency (can get by) to fluency (can practice) to leadership (can create new solutions or methods).
That is, we can think of a continuum of knowledge, skills, interests, and goals, ranging from that which characterizes the data consumer to the data citizen to the data science contributor. A Type C data science includes this dimension of ‘depth’ as well.
1.2 Google and the liberal arts
Data science is at its core empirical, and all of this rhetoric would be meaningless if not grounded in real world findings. Although it was reported in late 2017 that soft skills rather than STEM training were the most important predictors of success among Google employees, it’s difficult to know whether these results would generalize to a less select group. Nonetheless, there is a clear need for individuals with well-rounded training in the liberal arts in data science positions and, conversely, learning data science is arguably a key part of a contemporary liberal arts education.
1.3 TMI
A primary difference between traditional statistics and data science is that the former is typically concerned with making inferences from datasets that are too small, while the latter is concerned with making sense of data that is or are too big (donoho2017?). Data science is fundamentally concerned with the problem of “too much information,” or TMI.
In one sense, the idea of TMI is not new. In the 19th Century, Wilhelm Wundt argued that attention was the distinguishing act of the human mind (Blumenthal 1975). In attending to (or focusing on) something, we must overlook everything else, consequently, selection is the essence of human perception (erdelyi1974?). Selection is important not just in psychology, but in the arts as well, for editing, or choosing what not to write or show, is at the core of the creation of works including novels and film (ondaatje2002?).
So the problem of TMI is not new. Yet today, this problem exists at a much greater scale, for there is simply more information around us. Indeed, over the last 20 years, the amount of digital information in the world has increased roughly 200-fold.1
Like perception in psychology and editing in the arts, data science is concerned with extracting meaning from information. Because the amount of information around us has mushroomed and its nature has become more important, our need to extract meaning has become more ubiquitous and more urgent. For these reasons, data science is a foundational discipline in 21st century inquiry.
References
According to Wikipedia, the Zettabyte (ZB) Era began in 2012, when the amount of digital information in the world first exceeded 1 ZB (or 1021 bytes). In 2025, it is estimated that the world will house 175 ZBs of digital data (Reinsel, Gantz, and Rydning, n.d.), hence a 175X increase in in 13 years. My estimate of a 200X increase in 20 years is a conservative extrapolation from these numbers. Incidentally, one ZB = 1,000,000,000,000,000,000,000 bytes, which could be stored on roughly 250 billion DVDs, or 500 million 2 TB hard drives.↩︎