4 R stands for …
Historically, R grew out of S which could stand for Statistics. But what does R stand for?
R is a system for Reproducible analysis, and reproducibility is essential. R markdown documents, like Jupyter notebooks in the Python world, facilitate reproducible work, as they include comments or explanations, code, links to data, and results.
R is for Research. Research is not just an end-product, not just a published paper or book:
… these documents are not the research [rather] these documents are the “advertising.” The research is the “full software environment, code, and data that produced the results”
(Buckheit and Donoho 1995; D. L. Donoho 2010, 385). When we separate the research from its advertisement we are making it difficult for others to verify the findings by reproducing them (Gandrud 2013).
R is a system for Representing data in cool, insight-facilitating ways, a tool for creating (reproducible) data visualizations which can provide insights and communicate results.
R is Really popular, and this matters, because learning R will make you a more attractive candidate for many graduate programs as well as jobs in the private sector.
Because R is popular, there are many Resources, including, for example -
- Online resources include the simple (and less simple) lessons of SwirlR, which offers the possibility of “learning R in R,” as well as DataCamp, the Data Science Certificate Program at Johns Hopkins, and other MOOCs.
- Books include (Peng 2014) - which includes not only videos of his lectures in the program at Hopkins, but also a brief list of still more resources - and (Wickham and Grolemund 2016).
- You’ll also learn (more directly) from people, including your classmates, as well as the broader community of people around the world. There are hundreds if not thousands of people, young and old, who are on the road with you. I am as well, just a step or two (hopefully) ahead.
R might stand for Relatively high level. Programming languages can be described along a continuum from high to low level, the former (like R) are more accessible to humans, the latter (like assembly language) more accessible to machines. Python, Java, and C++ are all more towards the middle of this continuum.
R does not stand for ‘[arggh](https://www.urbandictionary.com/define.php?term=ARGH),’ although you may proclaim this in frustration (‘arggh, why can’t I get this to work?) or, perhaps, in satisfaction (’arggh, matey, that be a clever way of doing this’).
But R does stand for Rewarding. A language is a way of thinking about the world, and this is true for computer languages as well. You’ll be challenged by its complexity, its idiosyncracy, its alien logic. But you will succeed, and you will find that you can do things that you did not believe possible.
4.1 a few characteristics of R
R includes the base together with packages. These packages (libraries) are customized add-ons which simplify certain tasks, such as text analysis. There are, at this writing, 15,373 available packages on the CRAN package repository - and though there is not yet an R package for ordering pizza (Peng 2014), there are many for most data tasks, including, for example, over 50 different packages for text analysis. So how do you choose, and where do you begin? We will start with the curated list of packages which jointly comprise the tidyverse (Wickham and Grolemund 2016), which is effectively a dialect of R.
R is an object-oriented language - one conceptually organized around objects and data rather than actions and logic. In R, at the atomic level, objects include characters, real numbers, integers, complex numbers, and logical. These atoms are combined into vectors, which generally include objects of the same type [one kind of object, ‘lists,’ is an exception to this; Peng (2014)]. Vectors can be further combined into data frames, which are two-dimensional tables or arrays. A tibble is a particular type of data frame which is used in the tidyverse. It is, in some ways, handier to work with than other data frames. We’ll be working extensively with data frames in general, and tibbles in particular, as we move forward.
Objects have attributes. Attributes of R include such things as name, dimensions (for vectors and arrays), class (that’s the type of object described in the previous paragraph), length, etc.
Real world data sets are messy, and frequently have missing values. In R, missing values may be characterized by NA (not available) or NaN (not a number, implying an undefined or impossible value).
RStudio, the environment we will use to write, test, and run R code, is a commercial enterprise whose business model, judged from afar, is an important one in the world of technology. Most of what RStudio offers is free (97% according to Garrett Grolemund in the video below). The commercial product they offer makes sense for a relative few, but it is sufficiently lucrative to fund the enterprise. The free product helps to drive the popularity of Rstudio; this widespread use, in turn, makes it increasingly essential for businesses to use. This mixed free/premium, or ‘freemium,’ model characterizes Slack as well, but while the ratio of free to paid users of Slack is on the order of 3:1, for R it is, I am guessing, an order of magnitude higher than this.
4.2 finding help
One does not simply ‘learn R.’ Unlike, say, learning to ride a bicycle, fry an egg, or drive a car with a manual transmission, learning R is not a discrete accomplishment that one can be said to have mastered and from which one then moves on. Rather, R is an evolving, open system of applications and tools which is so vast that there is always more that one can achieve, new lessons that one can learn. And, the complexity of R syntax is such that, for almost all of us, we will need help for coding on any non-trivial task.
For us, the key ideas in “looking for help” will include not just the tools on the RStudio IDE, but also (a) using Google searches wisely, and (b) reaching out to your classmates on Slack.
Here, as in the real world, there is an etiquette for help-seeking which is based on consideration. Your search for help should begin by making sure that others will encounter the same result, then by stripping the problem down to its essence. Once you have reduced the problem to this minimal, reproducible essence, you will often be able to spot the problem yourself - and, if not, you will make it easier for others to help you. There is an R package (reprex) which will likely facilitate this, but I haven’t tried it yet. Here is a good introduction.
Again, remember the 15 minute rule - we all need somebody to lean on.
Finally, to get a sense of some of the ways you can get help in RStudio (and to see how a master uses the R Studio interface), consider this video:
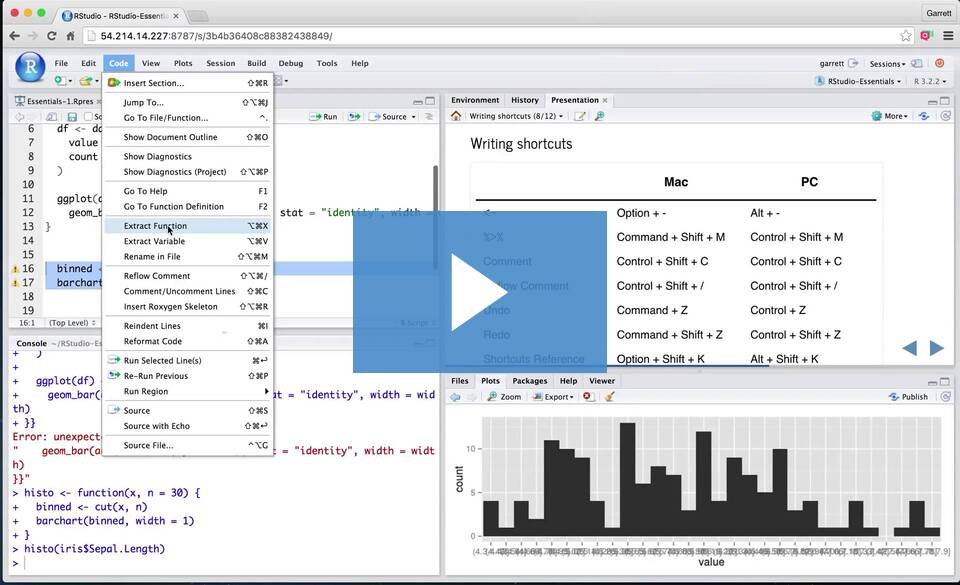
video 4.1: Garrett Grolemund of RStudio
4.3 Wickham and R for Data Science
The first chapter of the Wickham text (Wickham and Grolemund 2016) provides both a framework for his approach and a brief introduction to the tidyverse which will be the dialect of R we will study in the weeks ahead.
Please read it now.